Copy Number Variation
Most of the genome comes in two copies, one from each parent, so the usual copy number is two. The exceptions are X and Y in males, which are present once each. Copy number variants (CNVs) are stretches of DNA present in more or fewer copies than that. They're the unbalanced structural variants, deletions and duplications, counted by how many copies are left, and they range from part of a gene to a whole chromosome.
Copy Number in Health and Disease
Everyone carries CNVs. Compared with the reference, a typical genome has about 1,000 large deletions and 160 other copy number variants, and most do no harm. Some are even useful. AMY1 makes amylase, the enzyme in saliva that starts breaking down starch, and the number of copies varies from person to person. People with more copies make more amylase, and people from populations with high-starch diets carry more copies on average.
Other CNVs cause disease. The largest are gains or losses of a whole chromosome or chromosome arm, called aneuploidy. In Down syndrome, people carry three copies of chromosome 21 instead of two. Smaller CNVs can have effects just as large. The 22q11.2 deletion removes about 3 million bases from one copy of chromosome 22. It turns up in about 1 in 3,000 to 1 in 6,000 births, and its effects range from heart defects and a weak immune system to learning difficulties and psychiatric illness.
Copy Number in Cancer
Cancer cells gain and lose DNA far more than normal cells. In more than 10,000 tumors, 88% had at least one whole-chromosome or arm-level change, and in 37% of tumors the entire genome had been doubled. Smaller, focused changes pick out particular genes:
- Amplification. A region holding an oncogene, a gene that pushes cells to grow, is copied many times over. In breast cancer, ERBB2 (also called HER2) can be amplified from twice to more than 20 times its usual copy number, and tumors that carry the amplification tend to come back sooner. It also became a target for drug development: in a trial, patients whose tumors made too much HER2 lived longer when an antibody that binds the HER2 protein was added to chemotherapy. In neuroblastoma, a childhood cancer of developing nerve cells, MYCN amplification goes with more advanced disease.
- Homozygous deletion. Both copies of a gene are lost, so none of its protein is made. It's one way to switch off a tumor suppressor, a gene that holds cell growth in check. CDKN2A, which makes a brake on cell division, is often lost this way, in many kinds of cancer.
Finding Copy Number Changes
Read Depth
The main signal is read depth. A region present in three copies instead of two gives about 1.5 times as many reads, and a region with one copy gives about half as many. Turning that into copy number takes a few steps:
- Count. Split the genome into bins, often thousands of bases long, and count the reads in each. The depth at a single base is too noisy to use on its own.
- Correct. Remove known biases. Regions unusually rich or poor in G and C are sequenced less evenly, reads from repeats can't be placed confidently, and duplicate reads from the same DNA fragment inflate the counts.
- Compare. Divide each bin by a baseline: the matched normal for a tumor, or a panel of normal samples sequenced the same way. This cancels the biases the corrections missed. Exome and targeted sequencing, which cover the genome unevenly, rely on this step most.
- Segment. Join neighboring bins with similar ratios into segments, each with a single copy number.
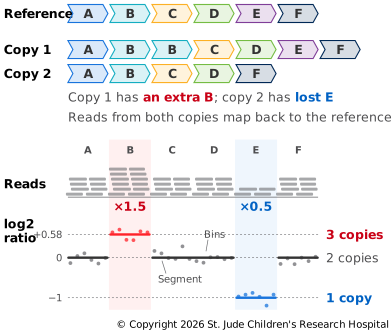
Ratios are usually reported on a log2 scale, so a bin matching the baseline scores 0. One copy where two are expected scores −1, three copies about 0.58 and four copies 1.
Depth gives a CNV's size and copy number, but its edges are only as sharp as the bins. Split reads and discordant read pairs (Finding Structural Variants) pin down the exact breakpoints and show where the extra copies went.
Allele Fractions
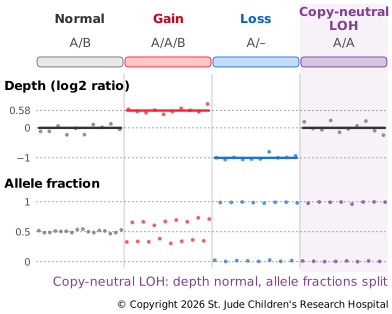
The second signal comes from heterozygous sites, where the two copies carry different bases. The share of reads showing one of them is its allele fraction, and normally it's about half. If one copy is duplicated, there are three copies, two of one base and one of the other, so the fractions shift to about two-thirds and one-third. If one copy is lost, every read shows the base that's left.
Allele fractions also catch a change depth can't see. In copy-neutral loss of heterozygosity (LOH), a cell loses one copy of a region and copies the other, so it still has two copies, but they're identical. Depth looks normal, yet every heterozygous site in the region now reads as homozygous. In cancer, this is a common way to lose the last working copy of a tumor suppressor, the second of the two hits.
Tumors Complicate Things
A tumor sample is never pure. Normal cells mixed in pull every signal toward normal: in a sample that's half tumor, losing one copy lowers depth to 75%, not 50%. The share of tumor cells in the sample is its purity. Whole-genome doubling shifts the baseline, too. A doubled tumor has about four copies of most regions, so its most common depth stands for four copies, not two. The tumor's average copy number is its ploidy. Copy number tools estimate purity and ploidy together, using depth and allele fractions at once.