How Tumors Evolve
What Is Cancer? described how a tumor grows from a single cell, with each new driver mutation setting off another wave of growth. That process is evolution by natural selection. The cells in a tumor differ from one another, some of them survive and divide better than the rest, and their descendants take over. This page follows that population of cells as it branches, spreads and survives treatment, and shows how its history can be read from sequencing data.
Evolution Starts Before Cancer
A clone is a group of cells that all descend from one cell, so they share the mutations that cell carried. Clones carrying mutations in cancer genes are common in healthy tissue. In 234 small pieces of normal, sun-exposed skin from the eyelids of four people, several cancer genes were under strong selection, and 18 to 32% of the skin cells carried a selected mutation. The skin was a patchwork of thousands of competing clones, yet it still did its job (Martincorena et al., 2015). In the lining of the esophagus in middle-aged and older people, clones with NOTCH1 mutations covered 12 to 80% of the cells. NOTCH1 mutations were several times more common in the normal esophagus than in esophageal cancers, so a mutation in a cancer gene doesn't by itself make a cell cancerous (Martincorena et al., 2018).
Blood shows the same thing. In blood DNA from more than 12,000 people, clones of blood cells carrying new mutations, most often in genes linked to blood cancers, were found in 10% of those older than 65 but in only 1% of those younger than 50. Over the next few years, people with one of these clones developed blood cancers at about 13 times the rate of those without (Genovese et al., 2014).
Tumors carry a record of this early history. Using whole genomes from 2,658 tumors of 38 kinds of cancer, researchers worked out the likely order in which many of each tumor's mutations arose. Driver mutations often appeared many years, and sometimes decades, before the cancer was diagnosed (Gerstung et al., 2020).
Trunk and Branches
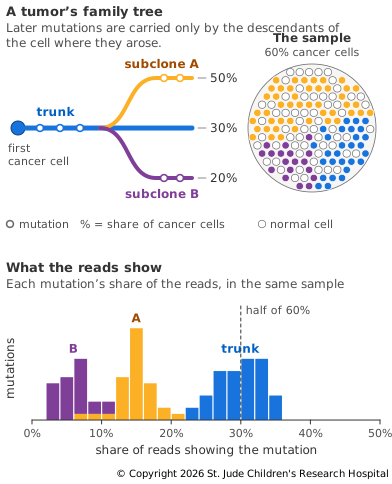
The cancer cells in a tumor descend from a common ancestor, so they all carry its mutations. These shared mutations are clonal. A mutation that arises later is passed on only to the descendants of the cell where it happened, a subclone, and it is subclonal. If a subclone later takes over the whole tumor, its mutations become clonal too. Drawn as a family tree, the clonal mutations form the trunk and the subclones form the branches (Dentro et al., 2017).
The branches can grow in different parts of a tumor. When researchers sequenced several separate pieces of the same kidney tumors, 63 to 69% of the mutations were missing from at least one piece. In one tumor, the gene SETD2 had been switched off by a different mutation in different regions, so separate branches had found the same way to grow (Gerlinger et al., 2012). In 100 early lung cancers, mutations in well-known drivers such as EGFR, BRAF and TP53 were almost always in the trunk, but more than 75% of the tumors also had drivers that arose later, in only some of their cells (Jamal-Hanjani et al., 2017). One sample from one part of a tumor can miss these branches.
Reading Clones in the Data
A tumor's tree can be estimated from the reads of a single sample. Take a mutation on one of the two copies of a chromosome. If every cancer cell carries it and the sample contained nothing but tumor, about half the reads covering that position would show the mutation. Normal cells in the sample carry only the reference base, so they dilute it. In a sample that is 60% tumor, a clonal mutation shows up in about 30% of the reads, and a mutation carried by only a third of the cancer cells shows up in about 10%. The share of reads showing a variant is its allele fraction, and the share of tumor in the sample is its purity.
Where a tumor has two copies of a chromosome, clonal mutations therefore pile up around one allele fraction, and each large subclone adds a smaller pile below it (Figure 2.8). Copy number changes can shift these piles. After correcting for purity and copy number, tools estimate the share of cancer cells that carry each mutation, its cancer cell fraction. They then group mutations with similar fractions, and each group stands for a likely clone or subclone that can be placed on a tree. Two subclones of similar size can blur into one group, so the tree is an estimate. Sequencing more than one sample from the same tumor, or the same tumor at more than one time, makes the tree much easier to work out.
Faster Change
Some tumors don't wait for mutations to build up one at a time. Losing a genome guard speeds up small changes, and other events change large parts of the genome at once.
- Whole-genome doubling. A cell copies its genome but doesn't divide, so it ends up with about four copies of every chromosome. Nearly 30% of 9,692 advanced cancers had been through this. It usually happened early, after a first driver mutation, and patients whose tumors had doubled tended to do worse (Bielski et al., 2018).
- Chromosomal instability. Cells that keep gaining and losing pieces of chromosomes as they divide produce a steady supply of new variety. In the 100 lung cancers above, ongoing chromosomal instability went along with greater differences between parts of the same tumor, and more variation in copy number between regions meant a higher risk of the cancer coming back or the patient dying.
- Chromothripsis. One or a few chromosomes shatter and are stitched back together in a single event. In whole genomes from 2,658 tumors, it was found in more than half of the tumors of several kinds of cancer, and it can amplify an oncogene or switch off other genes (Cortés-Ciriano et al., 2020).
Spreading
Metastasis is another step in the same process. The cells that seed a metastasis come from one or more branches of the tumor's tree, so a metastasis shares the trunk and adds new branches of its own. Those branches can split off early or late in the life of the original tumor (Turajlic and Swanton, 2016). In 126 lung cancers that went on to spread, the subclones that seeded metastases had already expanded inside the original tumor, which suggests they had been selected there. In 25% of cases, the cells that spread had split off early, before the last subclone had taken over the original tumor. In 32%, the metastases were seeded by more than one subclone (Al Bakir et al., 2023).
Surviving Treatment
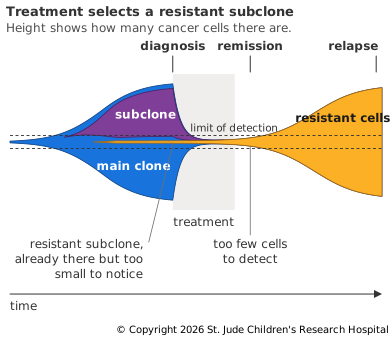
Treatment is a strong form of selection. A drug that kills most of a tumor's cells leaves behind any cells that can resist it, and those cells are often present before treatment starts. Their descendants become the relapse (Figure 2.9).
Childhood leukemia showed this clearly. In 61 children with acute lymphoblastic leukemia whose cancer came back after treatment, the leukemia at relapse usually carried a different set of copy number changes from the leukemia at diagnosis. Most relapses lacked some of the changes seen at diagnosis, so they came from an earlier branch of the tree. The cells responsible for the relapse were often already present as a small subclone at diagnosis (Mullighan et al., 2008).
In colorectal cancer, studies of drugs that block the receptor EGFR found that tumors without KRAS mutations often responded at first but almost always became resistant within several months. KRAS passes on the receptor's signal, so a KRAS mutation keeps the relay switched on even when the receptor is blocked. In 24 patients whose tumors had no detectable KRAS mutations before treatment, 9 (38%) later had KRAS mutations detected in their blood, usually 5 to 6 months after starting the drug. Modeling suggested that the resistant cells had been there all along (Diaz et al., 2012). Across 7,108 whole genomes from untreated early tumors and treated metastatic tumors, treatment had selected for known resistance mutations in 32% of treated patients and for likely ones in another 21% (Martínez-Jiménez et al., 2023).
Up Next
Every change on this page arose during a person's lifetime. Some people are born with a first hit already in every cell. Inherited Risk covers the genes involved and how often they explain cancer in children.