Hi-C
Hi-C shows how the genome is folded inside the nucleus. Laid end to end, the DNA in one human cell would stretch about two meters, yet it fits in a nucleus a few millionths of a meter across, and it isn't packed at random. Regions far apart along the DNA can sit right next to each other, as when an enhancer loops over to touch the promoter of a gene it controls. Hi-C finds which regions touch.
Like ChIP-seq, this page runs a little ahead of the rest of the guide. So far we've mostly treated DNA as a line of letters, but in the nucleus it's a physical strand that folds back on itself in three dimensions, so parts of a chromosome far apart in the sequence can touch, and so can parts of different chromosomes. How the genome folds, and what that folding does, is often called the 3D genome, and we don't cover it in depth yet. We've included Hi-C anyway for completeness, and we'll get around to the 3D genome properly one day.
What It Measures
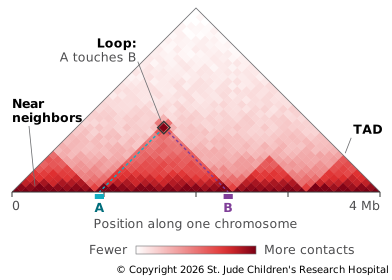
Hi-C measures contacts: for every pair of regions in the genome, how often they were close together in the cells. The result is drawn as a contact map, a square grid with the genome along both sides, where each square's color shows how often the two regions it joins were in contact. The two halves of the square mirror each other, so the map is often cut along its diagonal and turned 45 degrees, leaving a triangle that stands on the genome.
How the Library Is Made
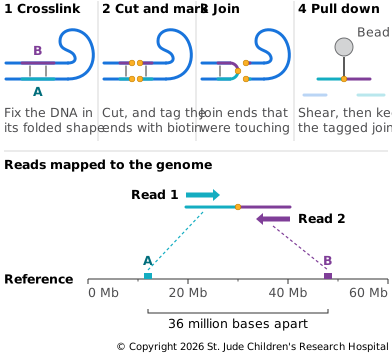
Hi-C turns closeness in space into something a sequencer can read: one DNA molecule made from two pieces that were touching (Lieberman-Aiden et al., 2009).
- Crosslinking. Formaldehyde fixes the DNA in its folded shape, as in ChIP-seq.
- Cutting. An enzyme cuts the DNA at a specific short sequence that appears all over the genome.
- Marking. The cut ends are filled in with bases that include one carrying biotin, the same tag used in hybrid capture.
- Joining. Ends that are close together in space are joined into one molecule. Because the DNA is still crosslinked, a cut end is most likely to join a piece that was next to it in the nucleus, even if that piece is far away along the chromosome, or on a different chromosome.
- Pulling down. The DNA is sheared, and fragments containing a join are pulled out by their biotin.
Each fragment is read paired-end. Read 1 comes from one side of the join and Read 2 from the other, so the two reads of a pair can land millions of bases apart, or on different chromosomes.
Depth and Read Setup
Hi-C needs a lot of reads, because it counts pairs of regions rather than single regions. The finer the detail you want, the smaller the squares in the contact map, the more squares there are to fill, and the more reads it takes to fill them.
Tradeoffs
Pros
- Genome folding. Hi-C revealed folding at several scales: - Compartments. At the largest scale, the genome splits into two compartments, one of open, active chromatin and one of closed, inactive chromatin. Regions in the same compartment contact each other more often, even across chromosomes (Lieberman-Aiden et al., 2009). - Domains. At a finer scale, the genome is divided into topologically associating domains (TADs), regions that contact themselves much more than their neighbors. In mouse cells, they had a median size of 880,000 bases. They're largely the same across cell types and conserved between species (Dixon et al., 2012). - Loops. At the finest scale, specific points come together, such as enhancers and the promoters they control.
- Genome assembly. Since contacts are most common between nearby DNA, Hi-C can order and orient pieces of a new genome assembly into whole chromosomes; it was used to assemble the genome of the mosquito Aedes aegypti into three chromosome-length pieces (Dudchenko et al., 2017).
- Rearrangements. A structural variant such as a translocation shows up as strong contacts between regions that shouldn't be close, so Hi-C can find rearrangements in tumor samples (Harewood et al., 2017).
Cons
Hi-C reports an average over millions of cells. A contact seen in the map may be present in only some of them, at any one moment.
Example: Moving a Boundary
TADs shape gene activity because enhancers mostly act on genes in their own domain, and the boundaries between domains keep them from reaching genes next door. A 2015 study showed what happens when those boundaries move (Lupiáñez et al., 2015). Near the gene EPHA4, a cluster of enhancers drives gene activity in the developing limb. In patients with three different limb malformations, structural variants had moved or deleted TAD boundaries near EPHA4. Each variant put the limb enhancers in the same domain as a different gene, switching that gene on in the limb where it should be off: PAX3 in brachydactyly (short fingers), WNT6 in F-syndrome, and IHH in polydactyly (extra fingers). Mice engineered to carry the same rearrangements showed the same misplaced gene activity in their limbs. None of the variants changed a gene; they changed the folding around it.